Inflation is a global economic force that affects how individuals and businesses manage their finances daily. It’s felt by everyone at checkout counters, gas stations, and while making rent payments. Across the globe, rising prices shrink purchasing power and test a country’s economic resilience. Understanding this volatility is crucial for financial stability, particularly for those using financial products powered by stablecoins for everyday payments.
To better understand where inflation is hitting consumers the hardest, we conducted a multi-part global analysis examining price changes across essential categories across 197 countries and territories, as well as 50 of the most populous U.S. cities. Combining international price data, consumer price indexes, and search behavior, we identified where financial pressure is rising most sharply across food, transportation, housing, clothing, and technology.
Key takeaways:
Food inflation takes the lead globally, impacting 158 countries; outpacing housing, transport, and clothing inflation increases.
Transportation and housing costs are surging quickest in the United States as higher fuel prices, public transit fares, rent, and utilities increase across the country.
Venezuela ranks as the country under the most financial stress, with an inflation rate of 682.1%. Haiti, Türkiye, and Antigua & Barbuda trail behind the South American country as the top countries under the most financial stress.
Where is Inflation Hitting the Hardest?
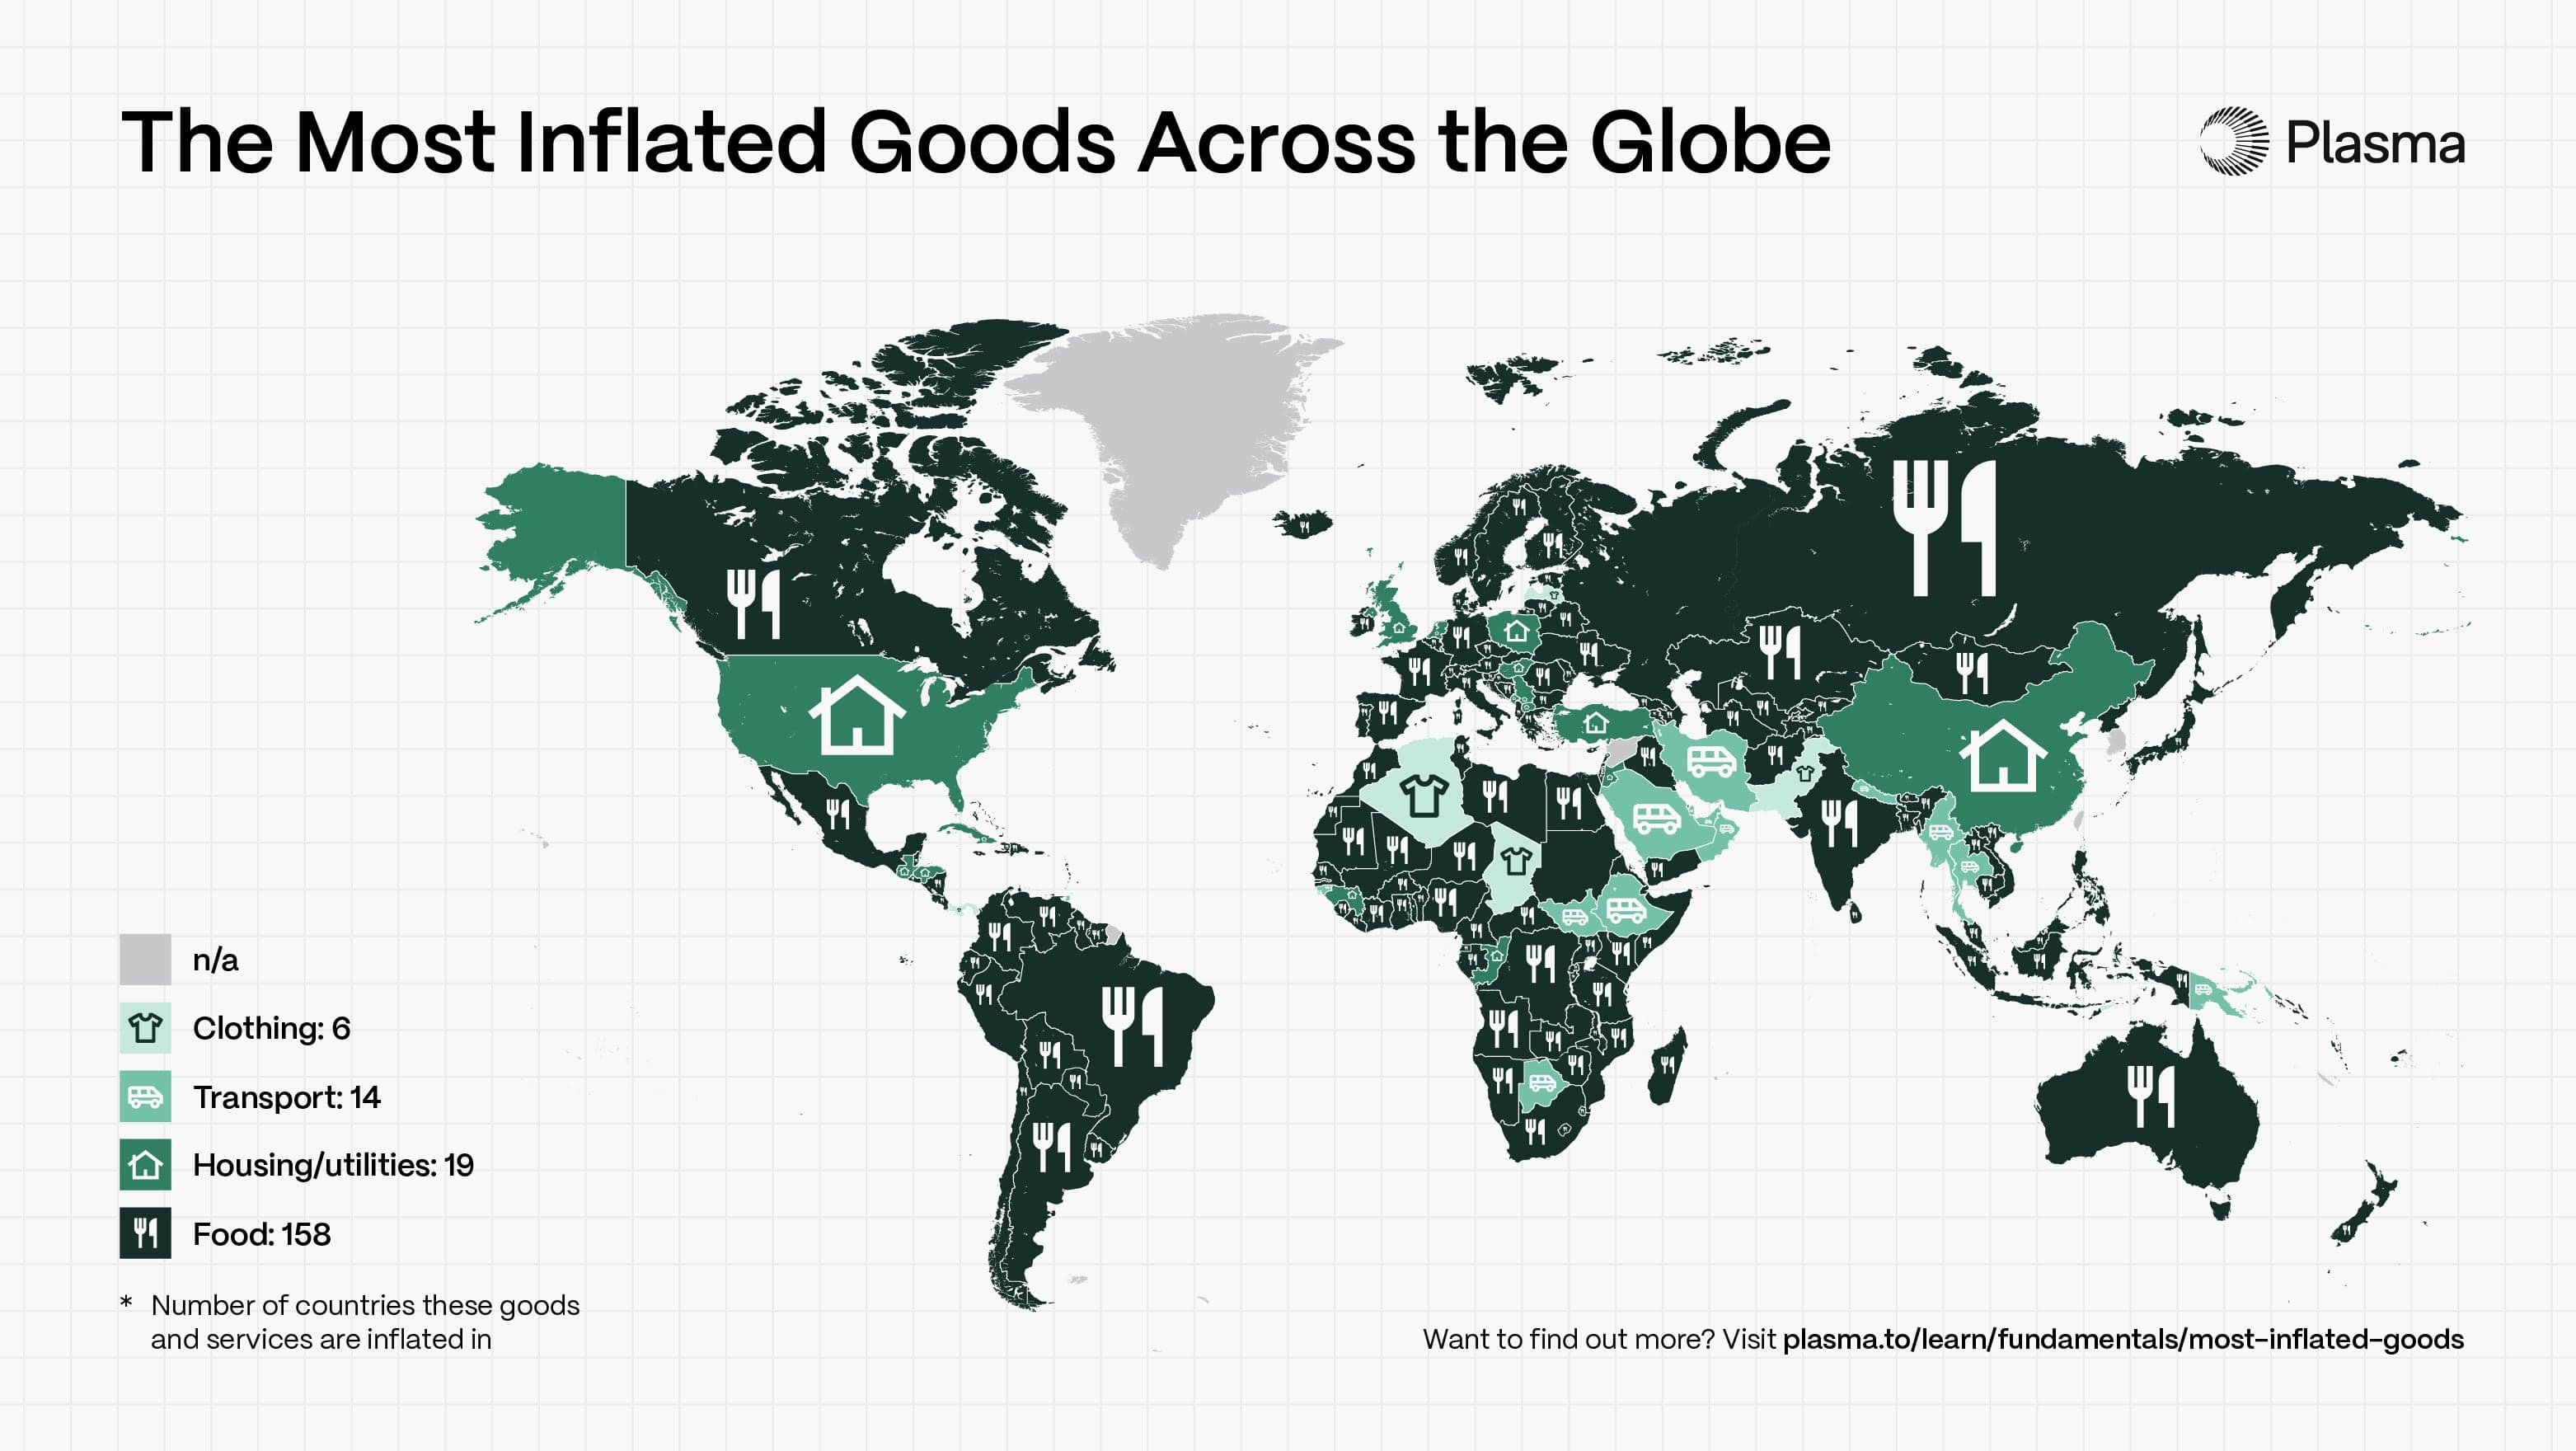
Image 1: Shows a map of the most inflated goods in each country, with icons denoting which good is the most inflated in each country, above a legend with details on each good category (clothing, transport, housing/utilities, and food).
Seeing inflation statistics in headlines is one thing, but the real impact shows up at checkout and in monthly bills. Across the categories analyzed, food is where residents of 158 countries feel the impact of inflation the most, outpacing housing, transport, and clothing. Housing and utilities follow, with 19 countries experiencing the most inflation in this category. Following closely behind is transportation, with 14 countries, and clothing, with 6 countries feeling inflation’s effects the most within the category.
The Most Inflated Food Items Across the Globe
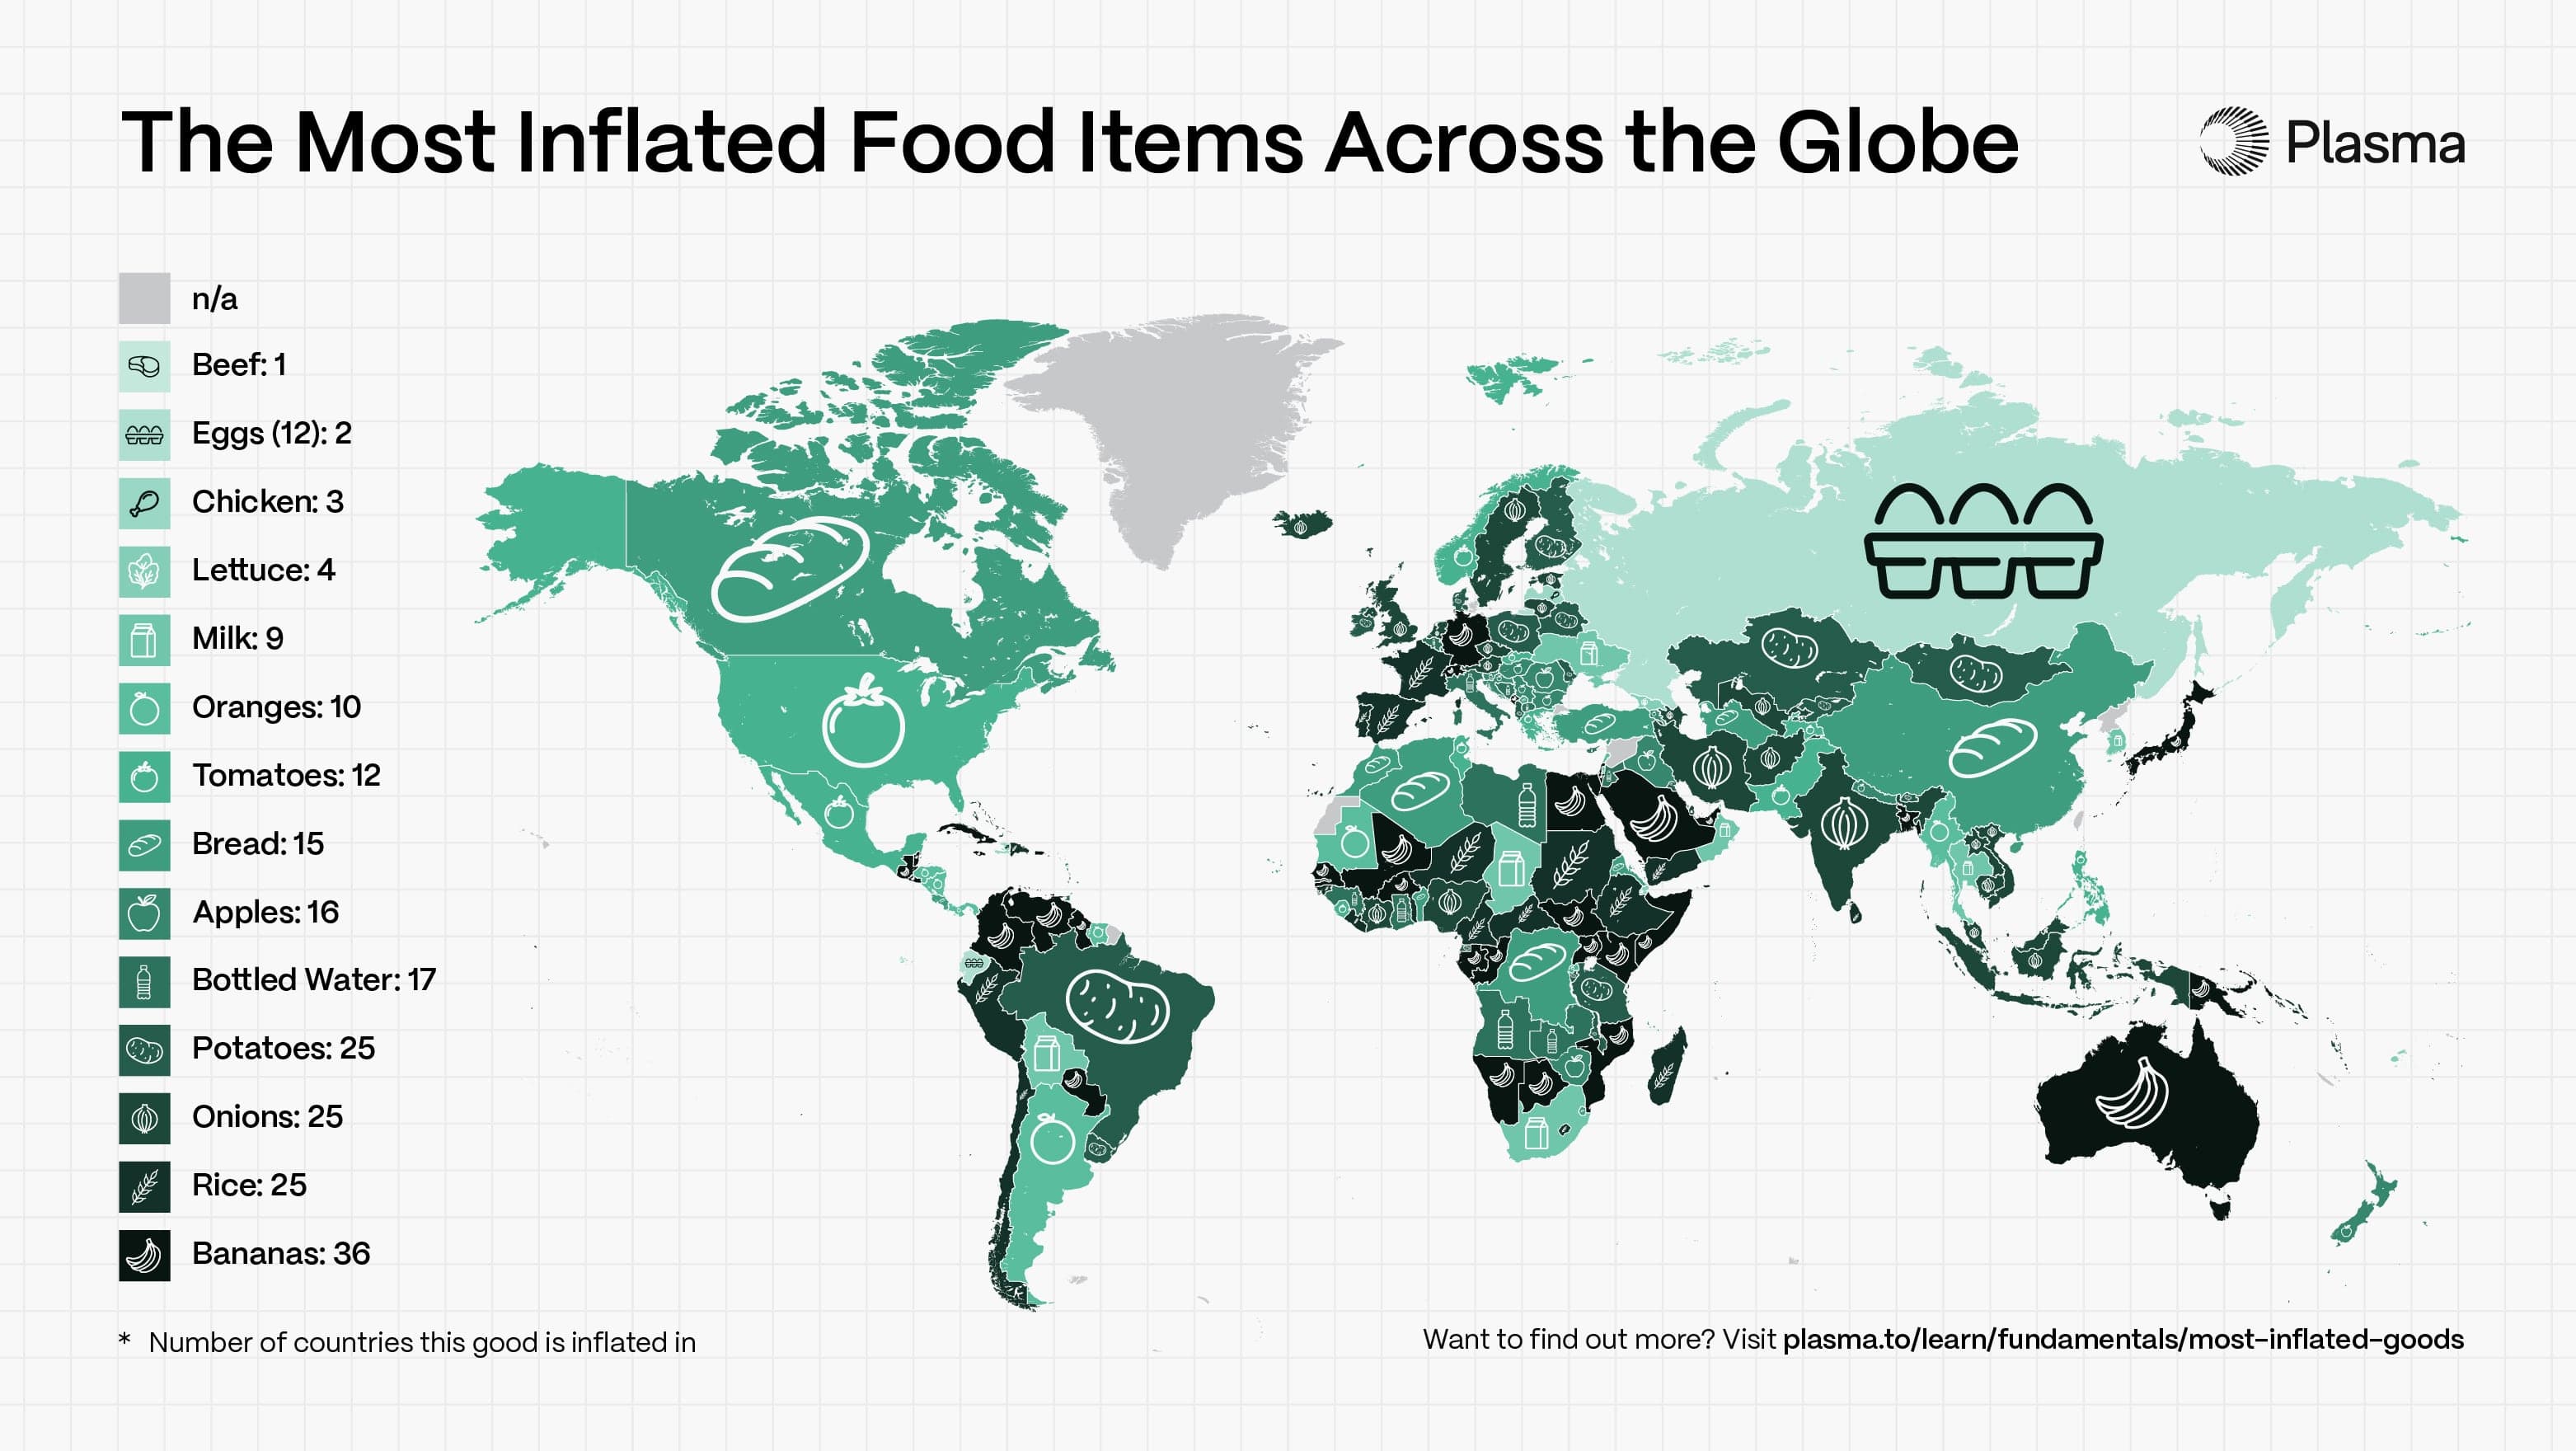
Image 2: Shows a map of the most inflated food items in each country, with icons denoting which food item is the most inflated in each country, above a legend with details on each food item (beef, eggs, chicken, lettuce, milk, oranges, tomatoes, bread, apples, bottled water, potatoes, onions, rice, and bananas).
Across the globe, food is the #1 essential where inflation is most widely felt. Rice and banana prices have increased by over 7% year-on-year globally, making two of the most widely consumed staple foods increasingly more expensive for households worldwide.
The Most Inflated Transportation Items & Services Across the Globe
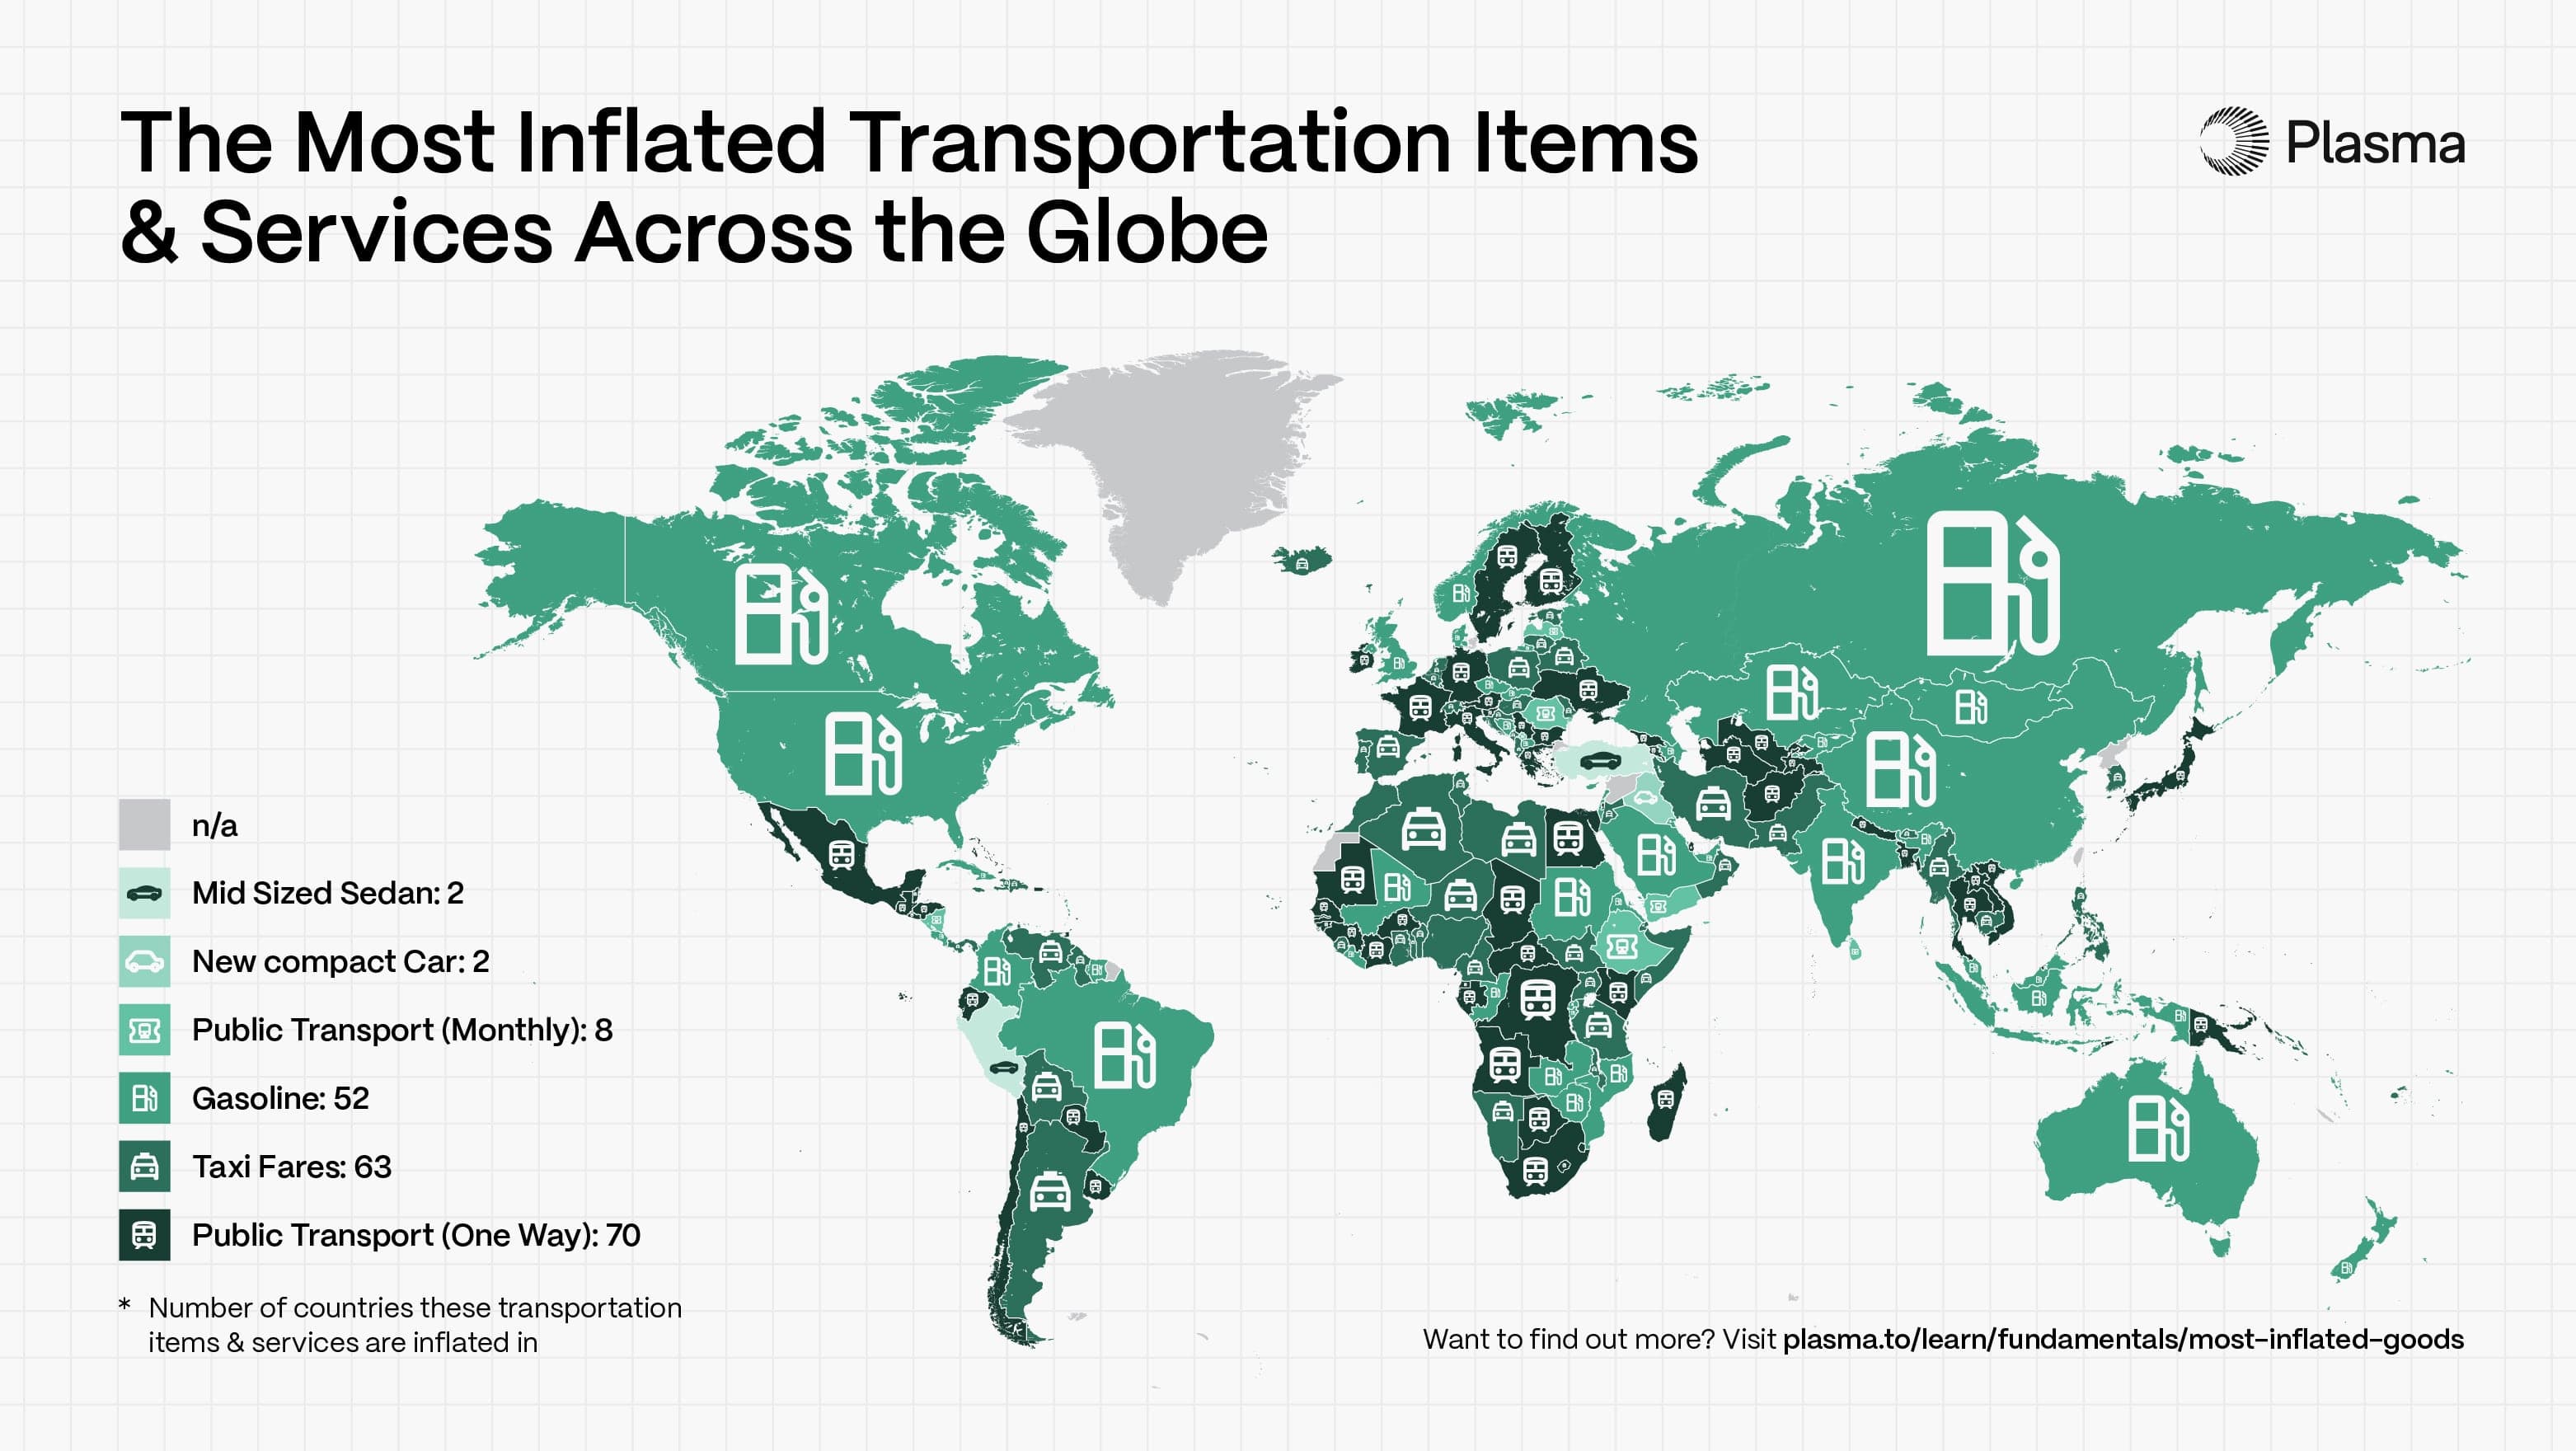
Image 3: Shows a map of the most inflated transportation items and services in each country, with icons denoting which good is the most inflated in each country, above a legend with details on each good category (mid-sized sedan, new compact car, monthly public transport pass, gasoline, taxi fares, and one-way public transport fares).
When it comes to transportation items and services, inflation pressures three key areas: one-way public transportation, taxi fares, and gasoline. One-way public transportation fare prices are the most inflated in 70 countries, making transport options, including buses and trains, more expensive for millions who rely on them. Trailing behind are taxi fares, with 63 countries experiencing price increases driven by higher base rates, per-mile rates, and hourly waiting fees. Gasoline prices top 52 countries, causing increases not only for personal vehicle costs but also for public transportation, machinery, and other gas-powered vehicles.
The Most Inflated Housing Items & Services Across the Globe
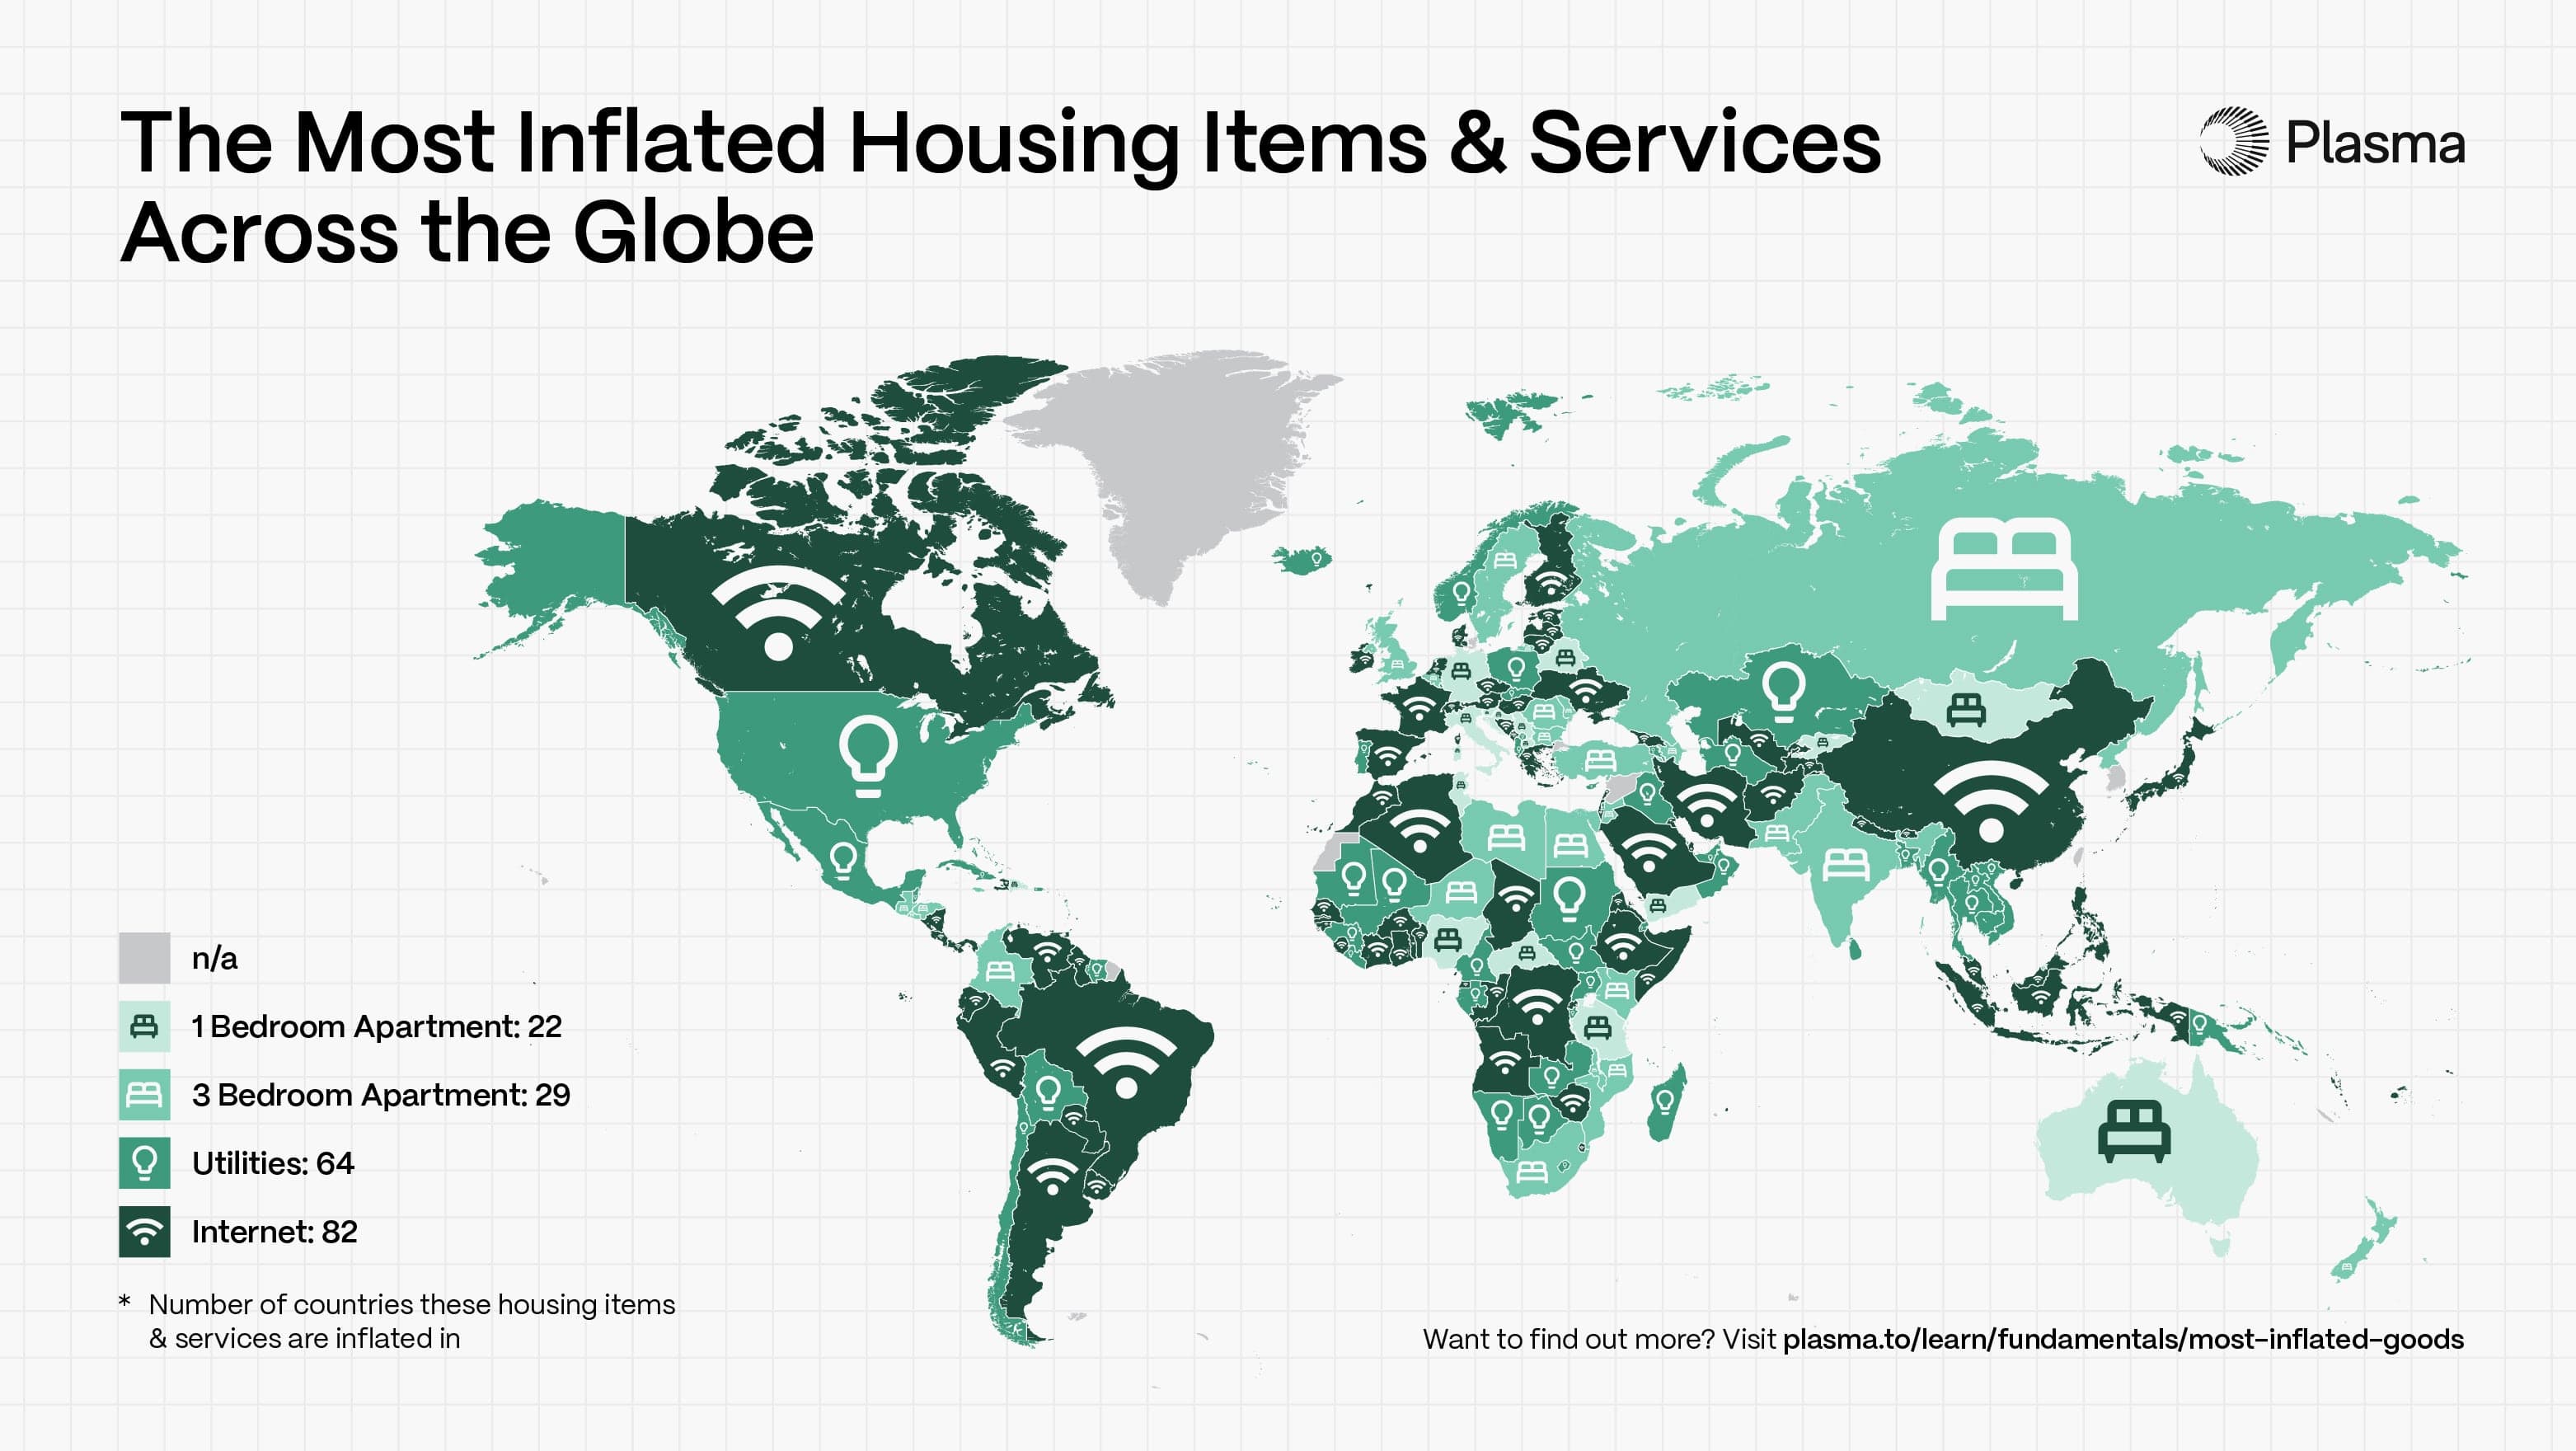
Image 4: Shows a map of the most inflated housing items and services in each country, with icons denoting which good is the most inflated in each country, above a legend with details on each good category (1-bedroom apartment, 3-bedroom apartment, utilities, and internet).
Households across the globe are feeling the squeeze as the cost of staying connected and maintaining a comfortable living environment grows. Internet prices are the most inflated housing costs in 82 countries, reflecting pressure on a service that many households consider essential. Additionally, 64 countries struggle with higher utility costs for services including electricity, heating, cooling, water, and garbage removal. Renters are also feeling the pressure as rent for three-bedroom apartments is most inflated in 29 countries, and one-bedroom units in 22 countries.
The Most Inflated Clothing Items Across the Globe
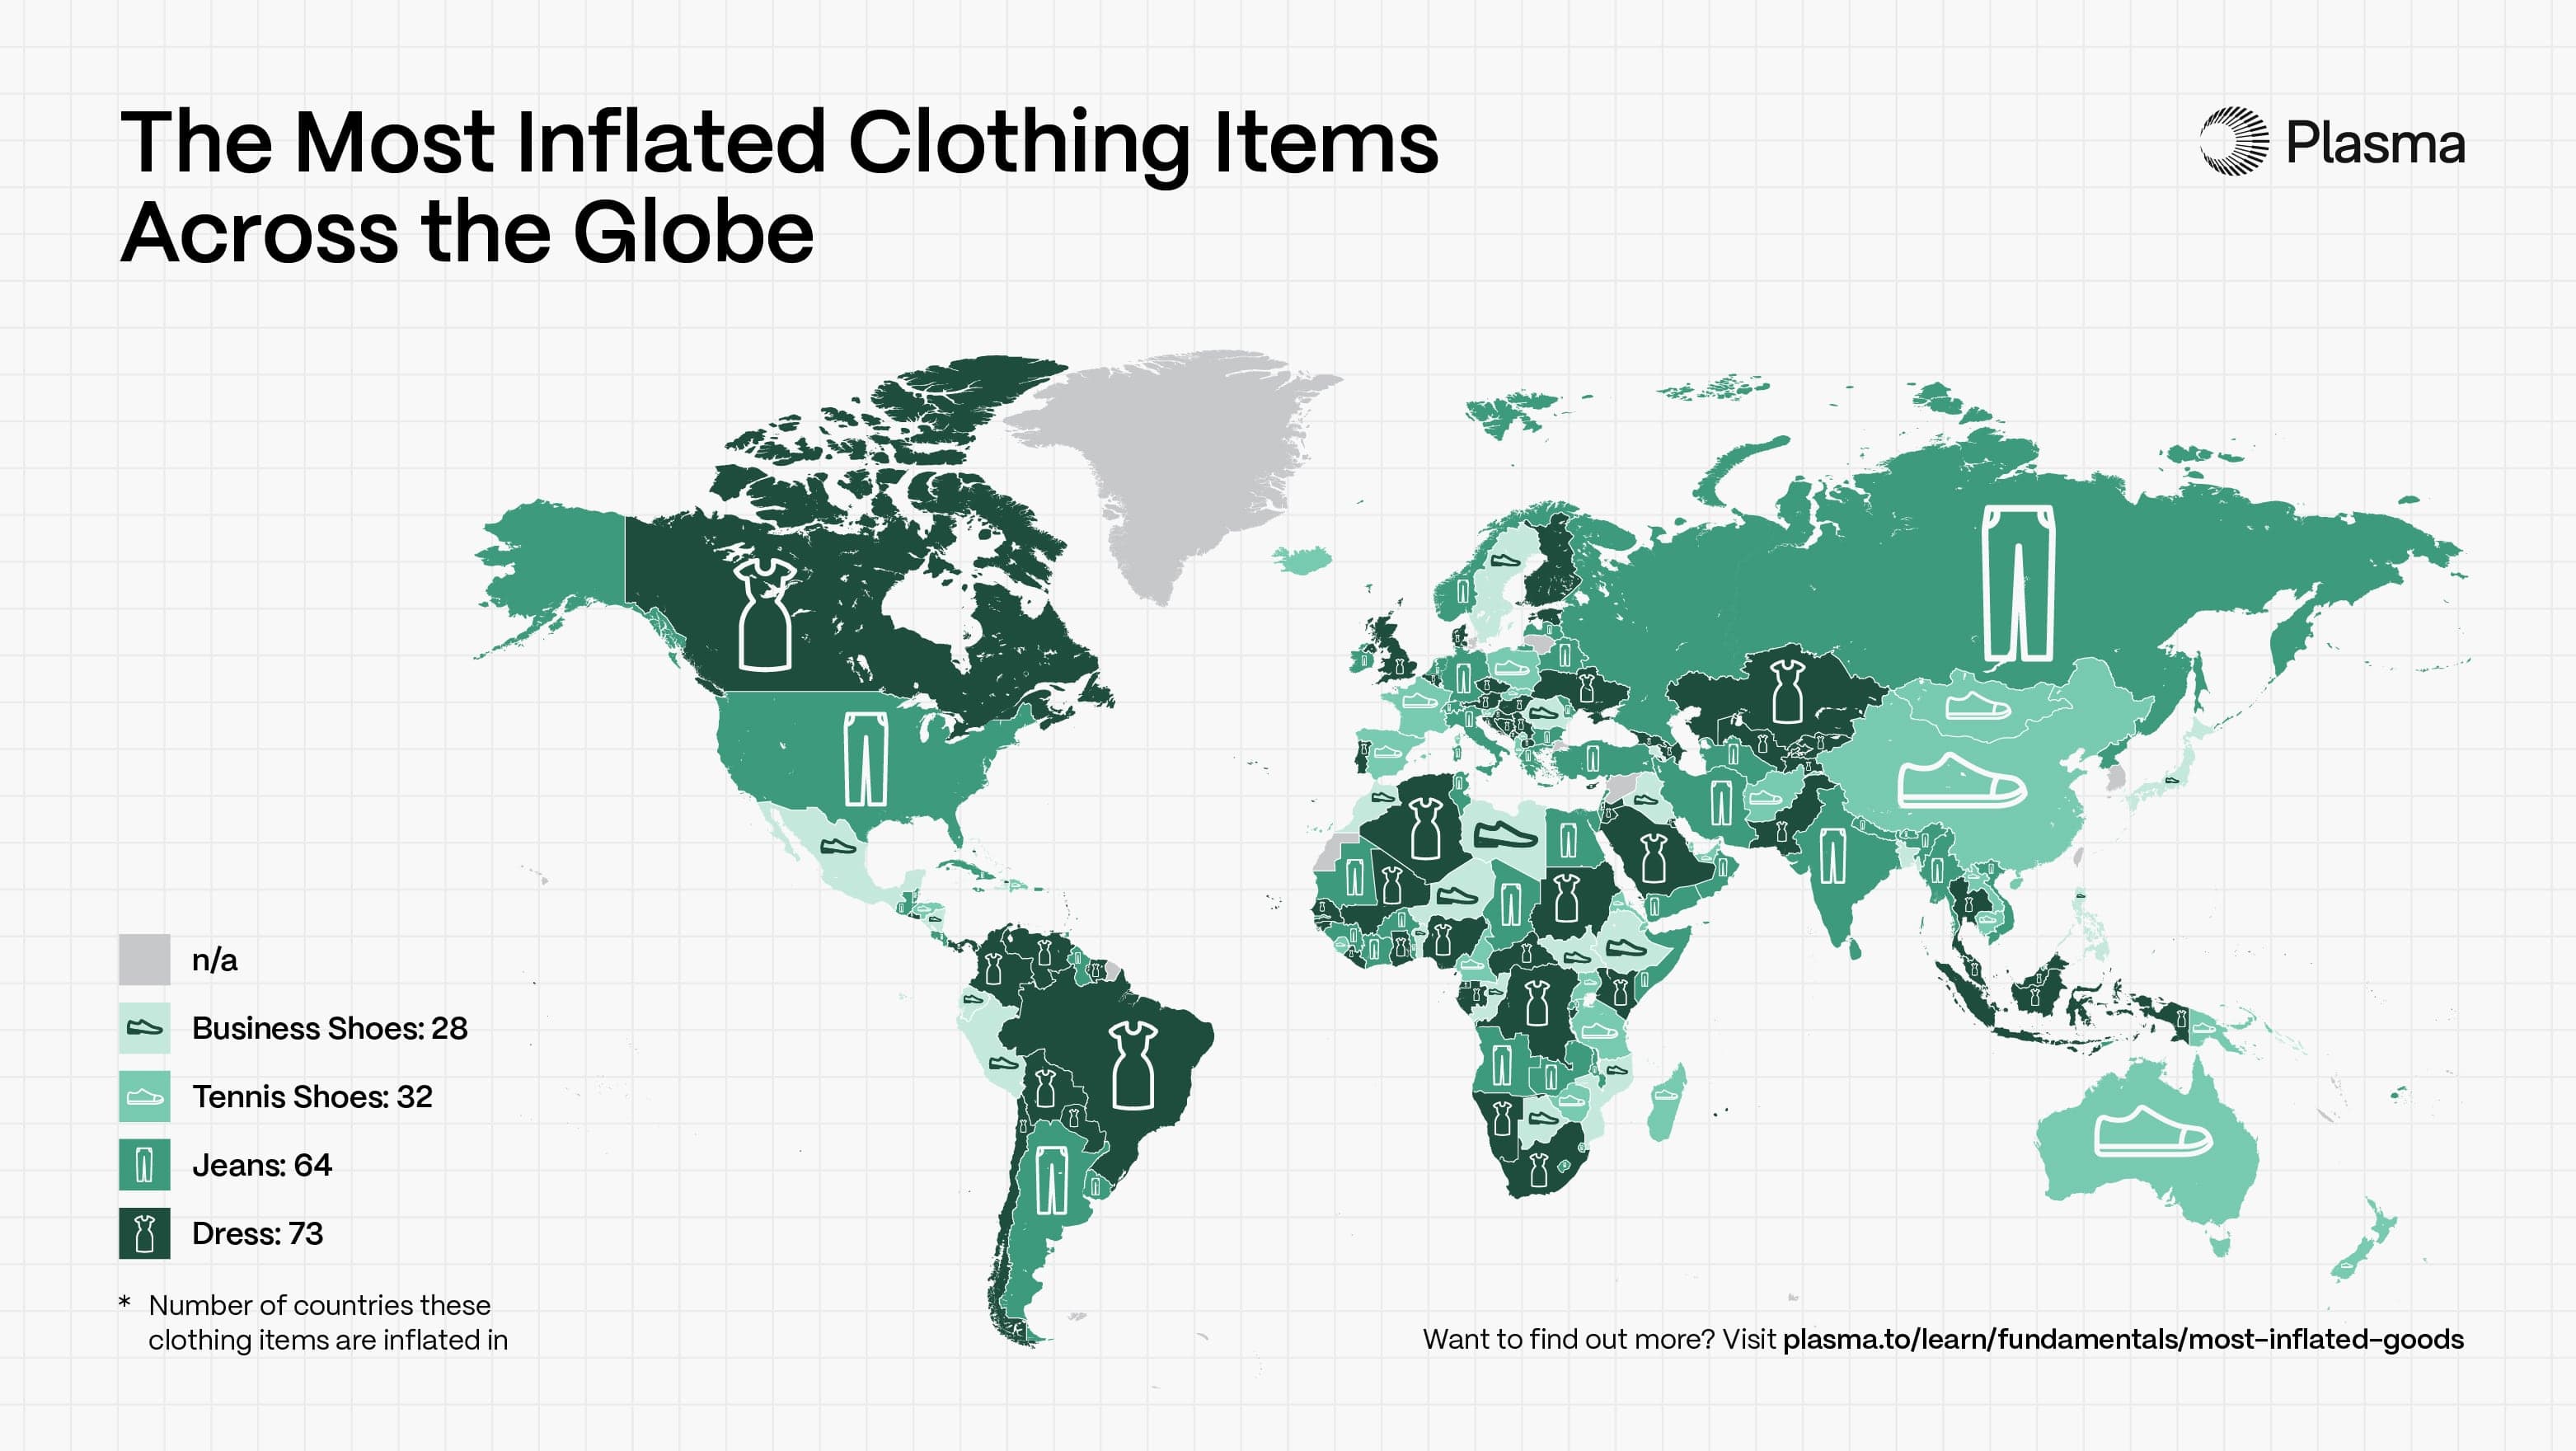
Image 5: Shows a map of the most inflated clothing items in each country, with icons denoting which good is the most inflated in each country, above a legend with details on each good category (business shoes, tennis shoes, jeans, and dresses).
Clothing items, from everyday basics to seasonal essentials, are experiencing price increases worldwide. Dresses are the most inflated clothing item in 73 countries, while jeans follow closely behind in 64 countries, showing rising costs for everyday closet staples. Additionally, prices for footwear have also increased, with tennis shoes being the most inflated clothing item in 32 countries and business shoes in 28 countries.
The Most Inflated Tech Items Across the Globe
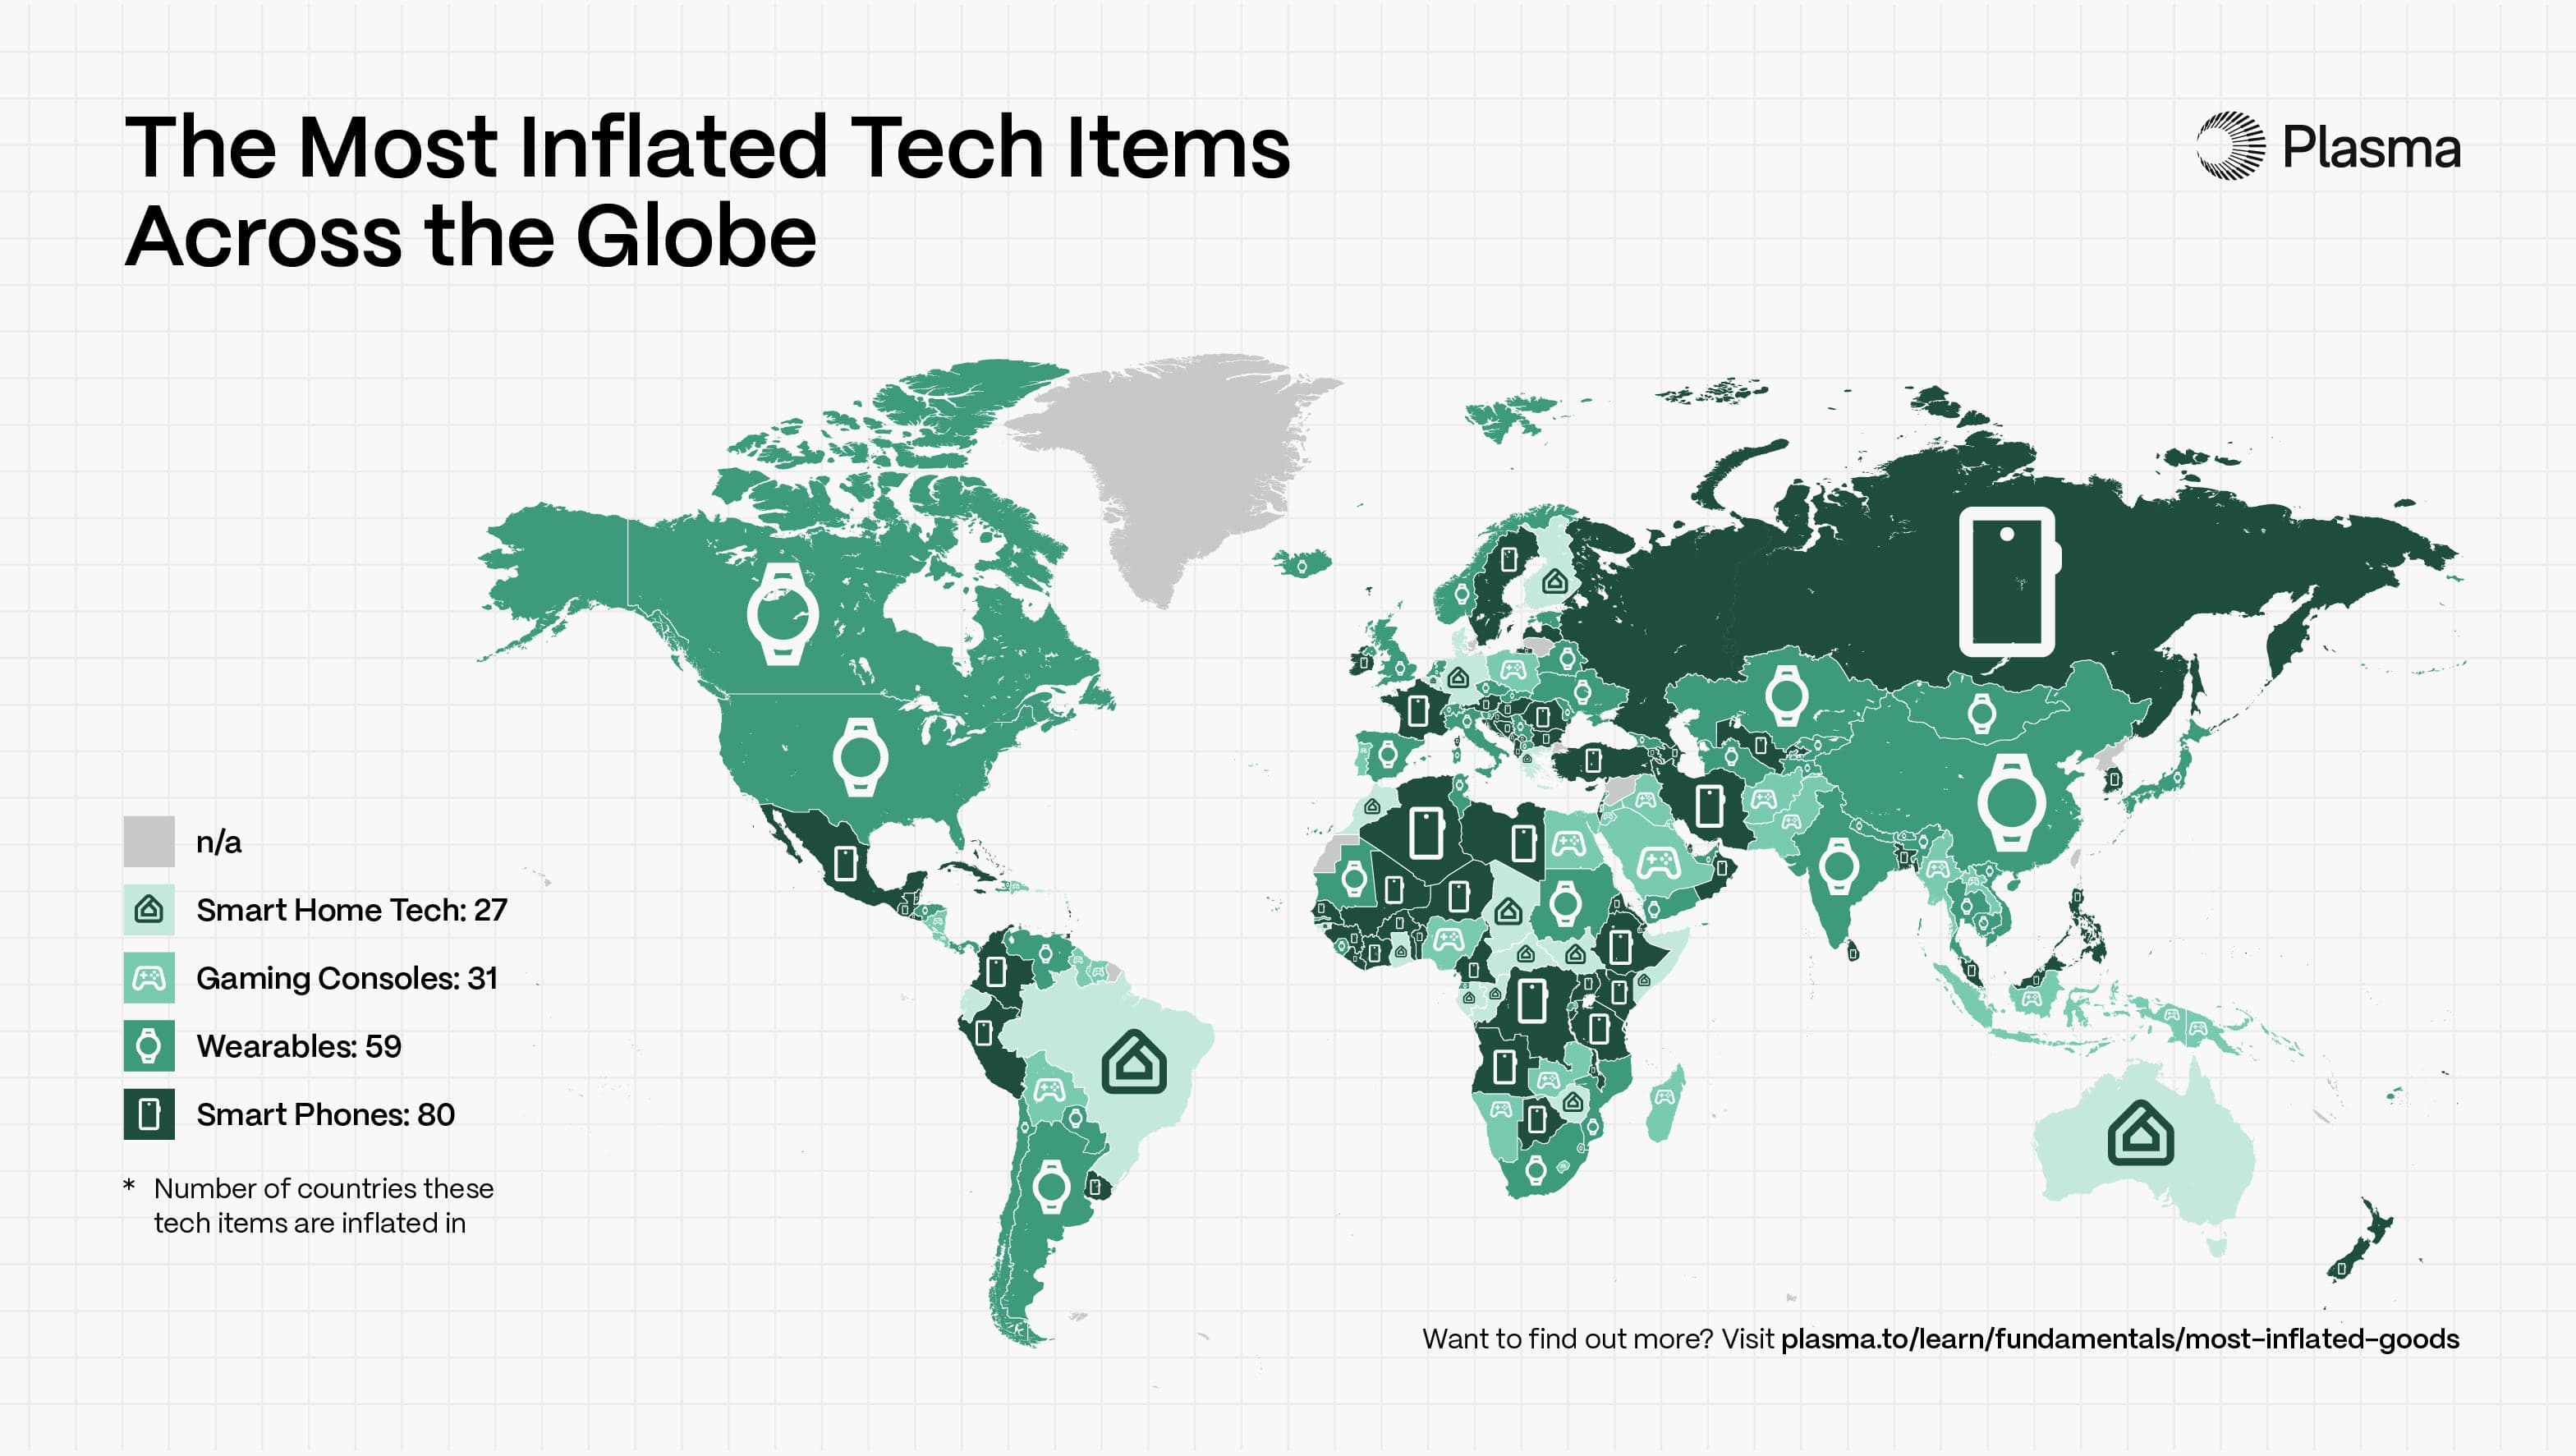
Image 6: Shows a map of the most inflated tech items in each country, with icons denoting which good is the most inflated in each country, above a legend with details on each good category (smart home tech, gaming consoles, wearables, and smartphones).
Smartphones are the most inflated tech item in 80 countries, reflecting their status as an essential item for much of the population across the globe. Wearable tech, including headphones, smart watches, and fitness trackers, follows behind, dominating tech inflation in 59 countries. Gaming consoles and smart home tech are also commonly the most inflated items in this category.
Most Affordable Countries to Purchase Tech
Where to Purchase Gaming Consoles
Gamers looking for the most affordable console options can find Xbox Series S 512GB consoles in Japan for just $288.04 and PS5 Digitals in Oman for $402.59.
Where to Purchase Smart Home Tech
For smart home tech like the Amazon Echo, the United States has the most affordable price, coming in at only $87.97. For homeowners and renters looking to monitor front doors, Ring Doorbell Plus Cameras have a low price of $102.05 in Germany, and Google Nest Mini (2nd Gen) sells for $37.48 in Canada.
Where to Purchase Wearable Tech
Widely known as expensive splurges, wearable tech like an Apple Watch SE3 has the lowest price found globally in Singapore, which comes out to $352.40. Japan and the United States take the lead for affordable wearable tech items, with Apple AirPod Pros priced at $333.35 in Japan, and though it’s still expensive, the cheapest place you’ll find an Oura Ring 4 is in the U.S. for around $543.29.
iPhone vs. Galaxy: Which is the Most Inflated in Each Country?
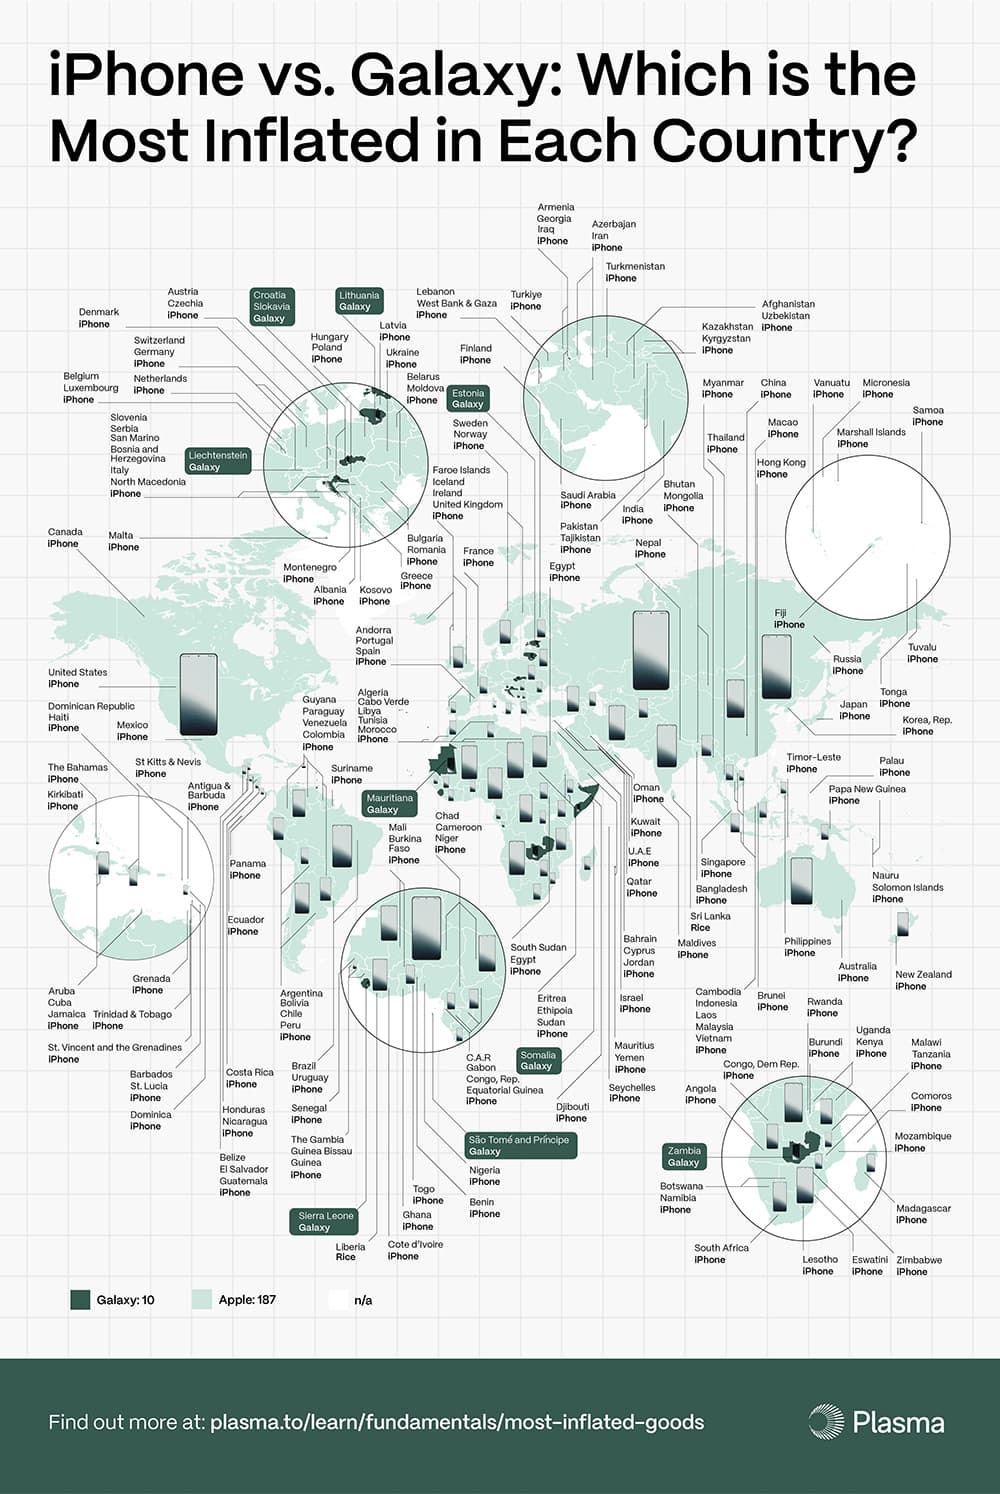
Image 7: Shows a map of the most inflated smartphones in each country (iPhone or Galaxy).
As tech innovation continues to make tech prices evolve around the world, it’s no surprise that some smartphones are more affected than others. In 187 countries, iPhones are experiencing the highest price increases, while Samsung Galaxys have increased in price in just 10 countries. In the U.S., iPhone base model prices have risen 33.39% since the device's original 2007 launch (from $599 at release to $799 for the current model), illustrating how smartphone costs have climbed over nearly two decades. Galaxy devices have seen a slightly lower price increase of 23.11%, with the first model costing buyers $649 and the latest model priced at $799.
Which Countries Feel Inflation the Most Around the World?
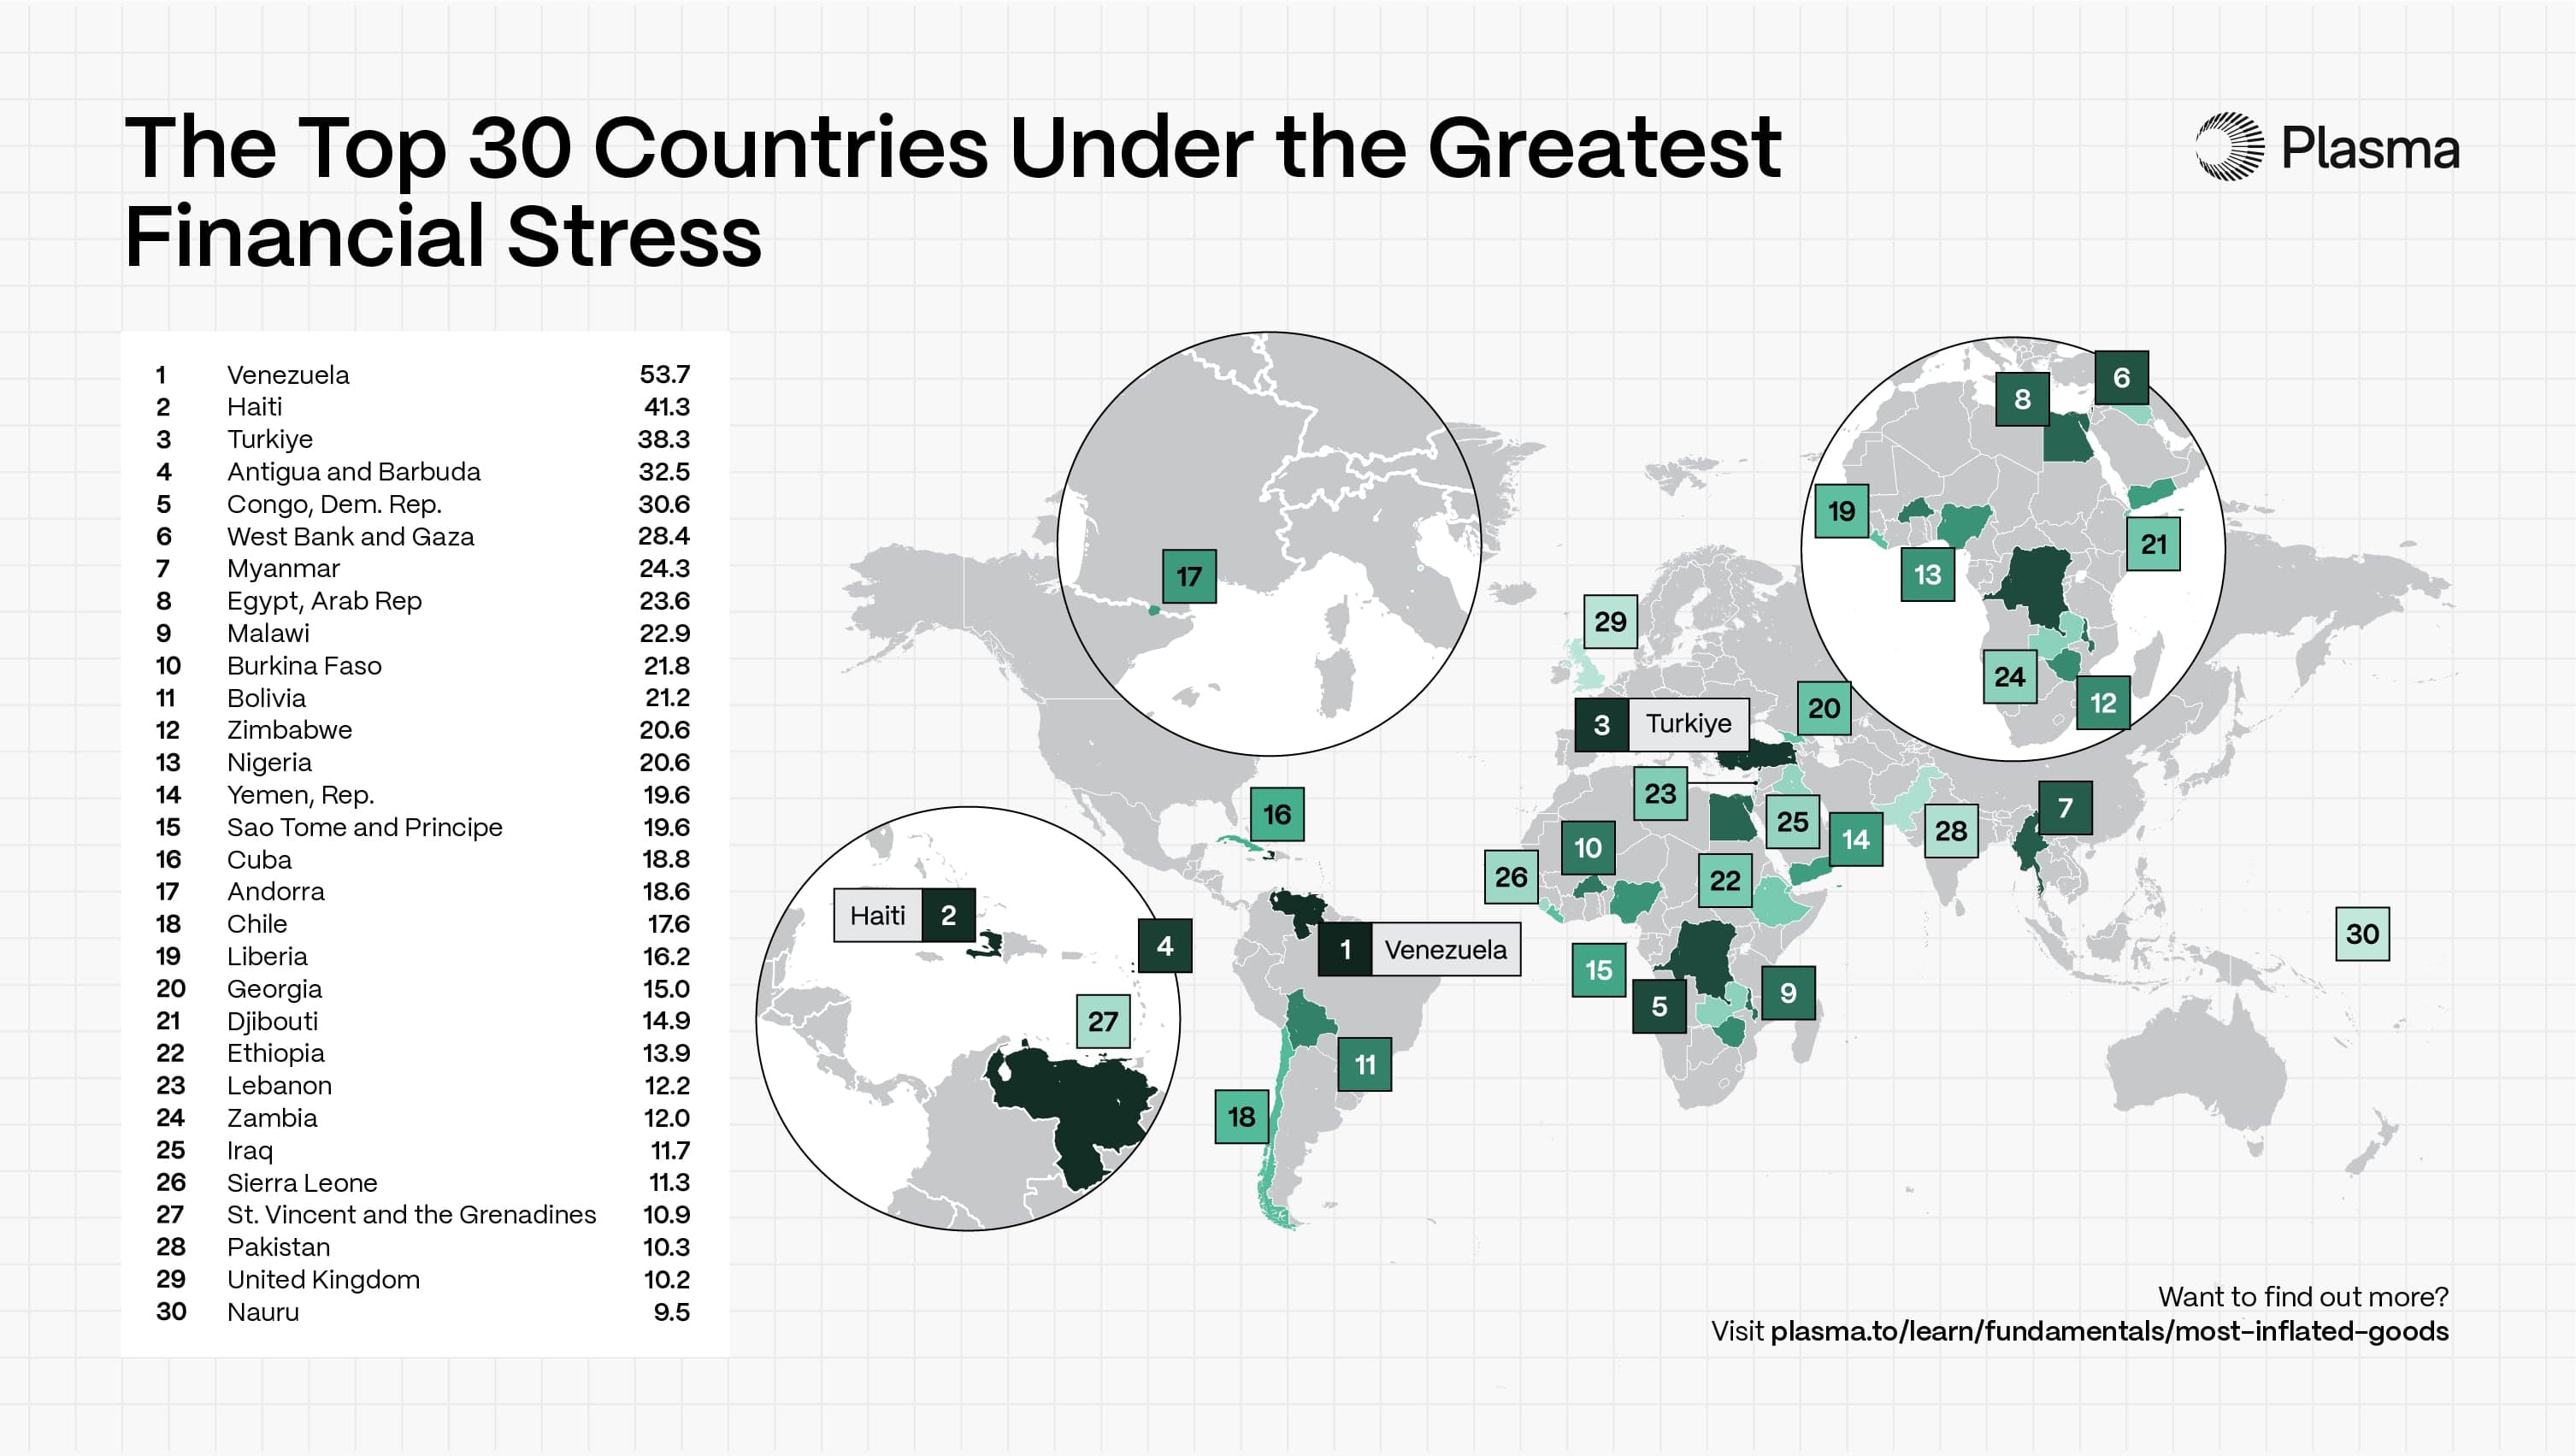
Image 8: Shows a map of the top 30 countries under the greatest financial stress alongside a table of the top 30 ranked countries.
Out of all countries and territories analyzed, Venezuela is the country under the greatest financial stress, with an inflation rate of 682.1% and a high consumer price index (CPI) across all categories, with food seeing the greatest inflation increase of 32.2% year-on-year. Haiti, Türkiye, and Antigua & Barbuda are all countries that are under great financial stress as well.
Check Out Our Ranking of the Countries Under the Greatest Financial Stress Below
Loading table...
The U.S. Cities with the Most Financial Concerns
Loading table...
1. Raleigh, North Carolina
Raleigh ranks as the #1 city where residents show the highest monthly search engagement around housing costs (2,260) and cost of living (48,500), suggesting these are front-of-mind financial concerns for residents. On top of that, a search volume per capita of 9,384 regarding cost of living and a search volume per capita of 437 for housing costs indicate the potential for heightened financial concerns, especially when the median rent price of a 1-bedroom unit is $1,450. When it comes to search interest for inflation, a strong volume of 13,110 (2,536 per 100,000 residents) shows residents are feeling the price increases around their city.
2. Atlanta, Georgia
Coming in as the #2 city is Atlanta, with monthly searches for inflation at 24,740 and 4,666 per capita, some of the highest in the ranking. Although the median rent price of a 1-bedroom unit in Atlanta is a moderate $1,544, the city has some of the highest per-capita search volumes for inflation-related terms, indicating a strong awareness among residents of rising prices. This is shown by high search volumes for cost of living (1,744 per 100k), housing costs (560), and cost of living (9,250).
Altogether, the data confirms what consumers across the globe already knew: inflation remains a significant challenge where spending is unavoidable. As the prices of essential goods and services rise faster than wages do in many places, households are forced to squeeze their budgets further just to make it by. Understanding what inflation hits hardest is a critical step towards navigating the current economic climate and preparing for what could come next.
Methodology
To understand how inflation is affecting consumers worldwide, we conducted a four-part analysis examining price changes and inflation rates across 197 countries and territories, as well as the 50 most populous U.S. cities, as defined by the U.S. Census Bureau 2023 population estimates. All data is accurate as of February 28, 2026.
I. Global Item-Level Inflation Analysis:
To determine which everyday goods have experienced the largest price increases globally, we analyzed products across five essential consumer categories:
Food
Transportation
Housing and utilities
Clothing
Technology
Current product price data was sourced from Numbeo, a global consumer price database that aggregates localized retail pricing across countries. Category-level inflation data was sourced from the International Monetary Fund (IMF) Consumer Price Index database.
Since consistent historical pricing for individual goods is not available across all countries, we estimated prior prices by applying each country’s category-specific CPI inflation rate to current product prices using the following formula:
Previous Price = Current Price ÷ (1 + CPI Rate)
We then calculated the estimated price change using:
Price Change % = (Current Price − Estimated Previous Price) ÷ Estimated Previous Price
Within each country and category, the product showing the largest estimated price increase was identified as the most inflated item.
Because category-level CPI rates were applied to individual goods rather than product-specific historical price series, these results should be interpreted as directional indicators of inflation pressure within each category rather than precise product-level inflation measurements.
II. Technology & Consumer Electronics Price Comparison:
To analyze inflation and affordability trends within the technology category, we evaluated pricing for several widely purchased consumer electronics products, including smartphones, gaming consoles, smart home devices, and wearable technology.
Smartphones: We compared the launch price of the original flagship models to the current flagship models available in 2026 for iPhone and Galaxy phones. Prices were converted to U.S. dollars using current exchange rates to ensure cross-country comparability.
Gaming consoles: Prices for the PS5 Digital, Xbox Series S 512GB, and Nintendo Switch 2 were sourced directly from manufacturer websites where available. For countries where official manufacturer pricing is not published, prices were sourced from Ubuy, a global retail platform. Ubuy prices may reflect import markups or reseller margins and should be treated as market-available estimates rather than official retail prices.
Smart home and wearable tech: For products such as the Oura Ring 4 or Google Nest Mini, where international prices are not publicly listed, we built an estimated price index using the U.S. retail price as a baseline, adjusted for local VAT/sales tax rates, import tariffs, and estimated shipping costs. These are modeled estimates and should be treated as approximations.
III. Global Financial Stress Weighted Rankings:
To identify where inflation is placing the greatest overall pressure on consumers, we developed a 100-point financial stress index ranking countries on both inflation indicators and consumer search behavior.
Each metric was normalised to a 0–100 scale by dividing each country's raw value by the highest observed value in the dataset, then multiplying by 100. That normalised score was then multiplied by the factor's assigned weight. All weighted scores were summed to produce the final result (e.g. a raw value of 50 against a dataset maximum of 100 yields a normalised score of 50, which at a 10% weight contributes 5 points to the total).
Google search volume for terms such as "cost of living," "inflation," and "housing costs" was included, measuring search activity over a 12-month period. Search volume is included as a behavioral signal of consumer awareness and concern around financial issues, but should not be interpreted as direct evidence of economic hardship. Inflation and CPI data were sourced from the IMF World Economic Outlook database.
Country scores were weighted as follows:
Factor Weight
Annual inflation rate (40%)
Food CPI (10%)
Transport CPI (10%)
Housing/Utilities CPI (10%)
Clothing CPI (10%)
Tech CPI (10%)
“Cost of living" search vol per 10k (5%)
"Inflation + [country]" search vol per 10k: (5%)
Example: Venezuela (score: 53.72)
Annual inflation rate:
682.1 ÷ 682.1 = 100.0 → × 40% = 40.00 pts
Food CPI:
32.2 ÷ 68.20 = 47.2 → × 10% = 4.72 pts
Transport CPI:
10.80 ÷ 33.10 = 32.6 → × 10% = 3.26 pts
Housing/Utilities CPI:
9.80 ÷ 59.64 = 16.4 → × 10% = 1.64 pts
Clothing CPI:
7.20 ÷ 31.00 = 23.2 → × 10% = 2.32 pts
Tech CPI:
3.80 ÷ 21.87 = 17.4 → × 10% = 1.74 pts
"Cost of living" search vol per 10k:
0.95 ÷ 271.74 = 0.3 → × 5% = 0.02 pts
"Inflation + [country]" search vol per 10k:
1.60 ÷ 393.92 = 0.4 → × 5% = 0.02 pts
Total: 53.72 / 100
IV. U.S. City Financial Pressure Weighted Rankings:
To identify where inflation is placing the greatest overall pressure on consumers in the 50 most populous U.S. cities, we developed a 100-point financial stress index ranking the cities on both housing costs and consumer search behavior.
Each metric was normalized to a 0–100 scale by dividing each city's raw value by the highest observed value in the dataset, then multiplying by 100. That normalised score was then multiplied by the factor's assigned weight. All weighted scores were summed to produce the final result.
Google search volume for terms such as "cost of living," "inflation," “bankruptcy filings,” and "housing costs" was included, measuring search activity over a 12-month period. To ensure a fair comparison across cities of different sizes, all search volumes were normalised per 100,000 residents using the U.S. Census Bureau 2023 population estimates. Search volume is included as a behavioral signal of consumer awareness and concern around financial issues, but should not be interpreted as direct evidence of economic hardship. Median rent data was collected from national rent market databases.
U.S. city scores were weighted as follows:
Factor Weight:
Median 1BR Rent (30%)
"Cost of Living" search volume per 100K (25%)
"Housing Costs" search volume per 100K (20%)
"Inflation" search volume per 100K (15%)
"Bankruptcy Filings" search volume per 100K* (10%)
Example: Raleigh, NC (score: 65.91)
Median 1BR rent:
$1,450 ÷ $3,650 = 39.7 → × 30% = 11.92 pts
"Housing costs" search vol per 100k:
437.30 ÷ 560.27 = 78.1 → × 20% = 15.62 pts
"Cost of living" search vol per 100k:
9,384.55 ÷ 9,384.55 = 100.0 → × 25% = 25.00 pts
"Inflation" search vol per 100k:
2,536.73 ÷ 5,094.75 = 49.8 → × 15% = 7.47 pts
"Bankruptcy filings" search vol per 100k:
181.89 ÷ 307.49 = 59.2 → × 10% = 5.92 pts
Total: 65.91 / 100
*Bankruptcy search interest was included as an indicator of consumer interest in debt-relief options rather than a confirmed measure of filing rates. Where two cities produced identical total scores, the city with the higher median 1-bedroom rent was ranked higher.
All data accurate as of February 28, 2026.